Field Usage in GraphOS
Understand field usage metrics including which clients and operations request which fields and how often
ⓘ NOTE
The retention period for field usage metrics depends on your plan. Refer to the pricing page for details.
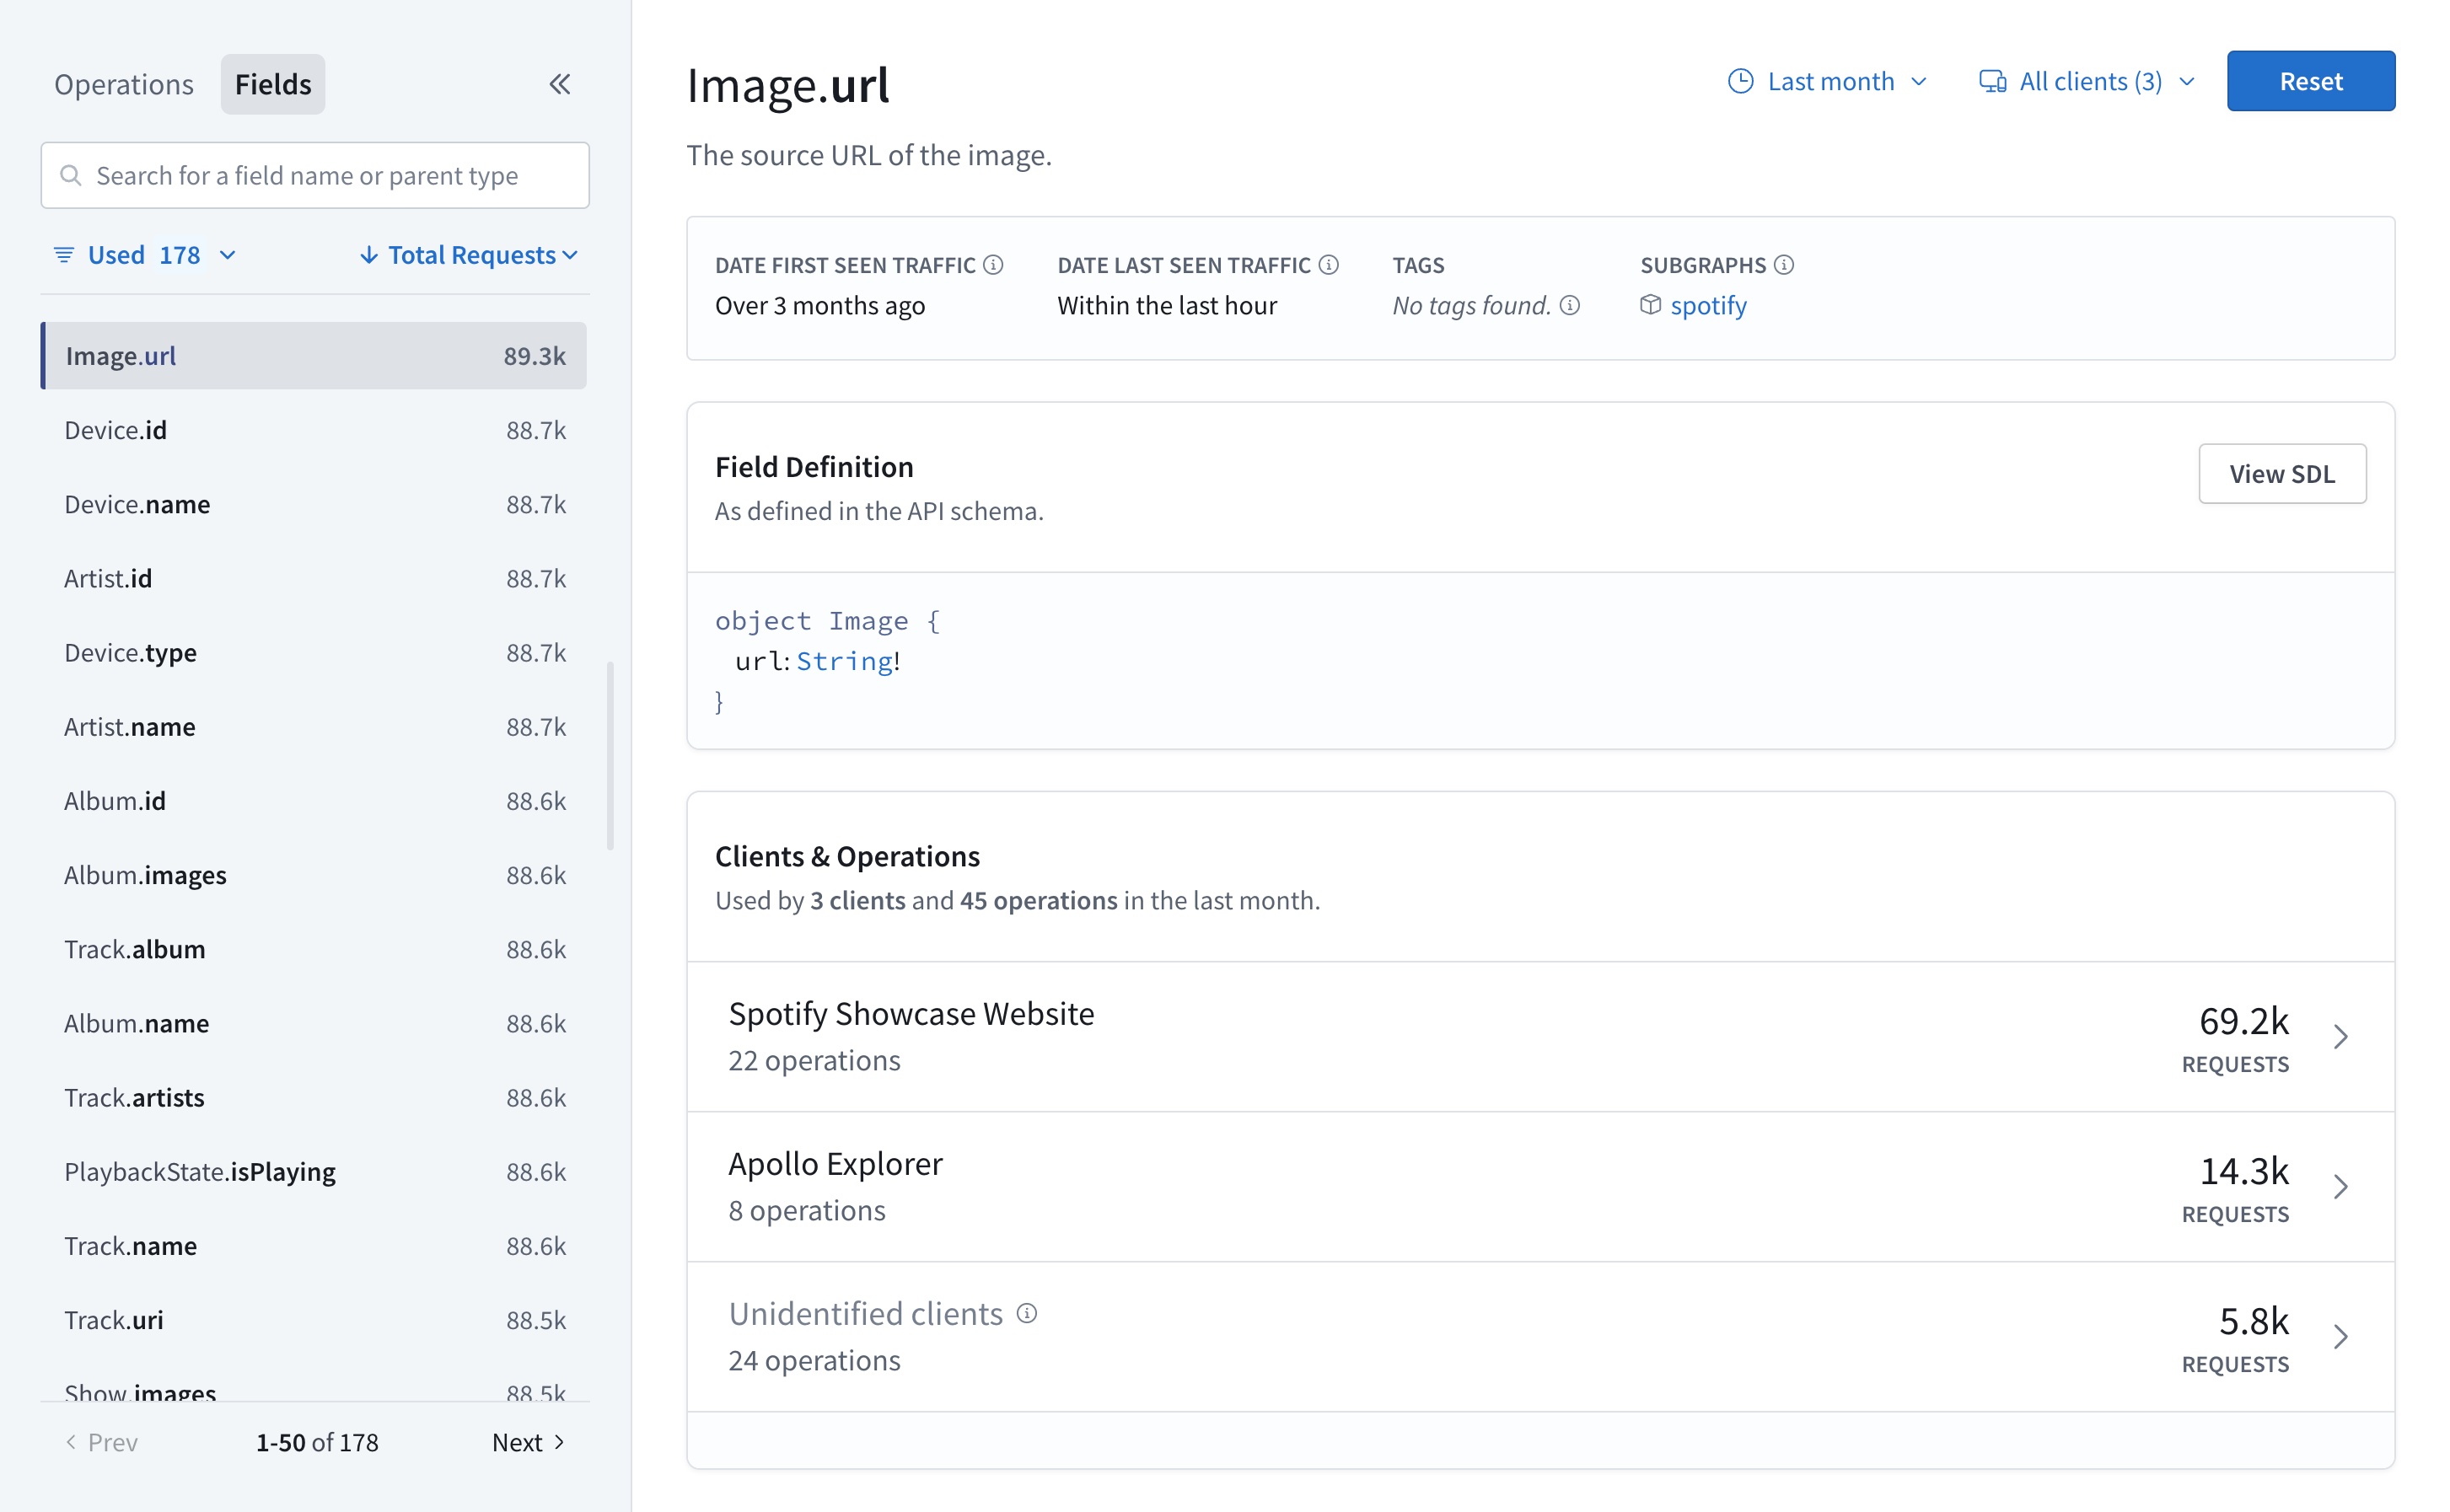
You can analyze the field metrics sent by your graph to GraphOS from any variant's Insights page in GraphOS Studio:

The Insights page presents operation and field metrics. It has two main sections:
- The collapsible left sidebar, where you can search, filter, and sort operations and fields
- The main insights view, which displays overall operations metrics by default, or field information and usage metrics for a single field once you select it from the left sidebar
This guide focuses on field metrics and information. Refer to Operation metrics in GraphOS for more information on the other metrics on this page, including resolver-level traces.
Field details
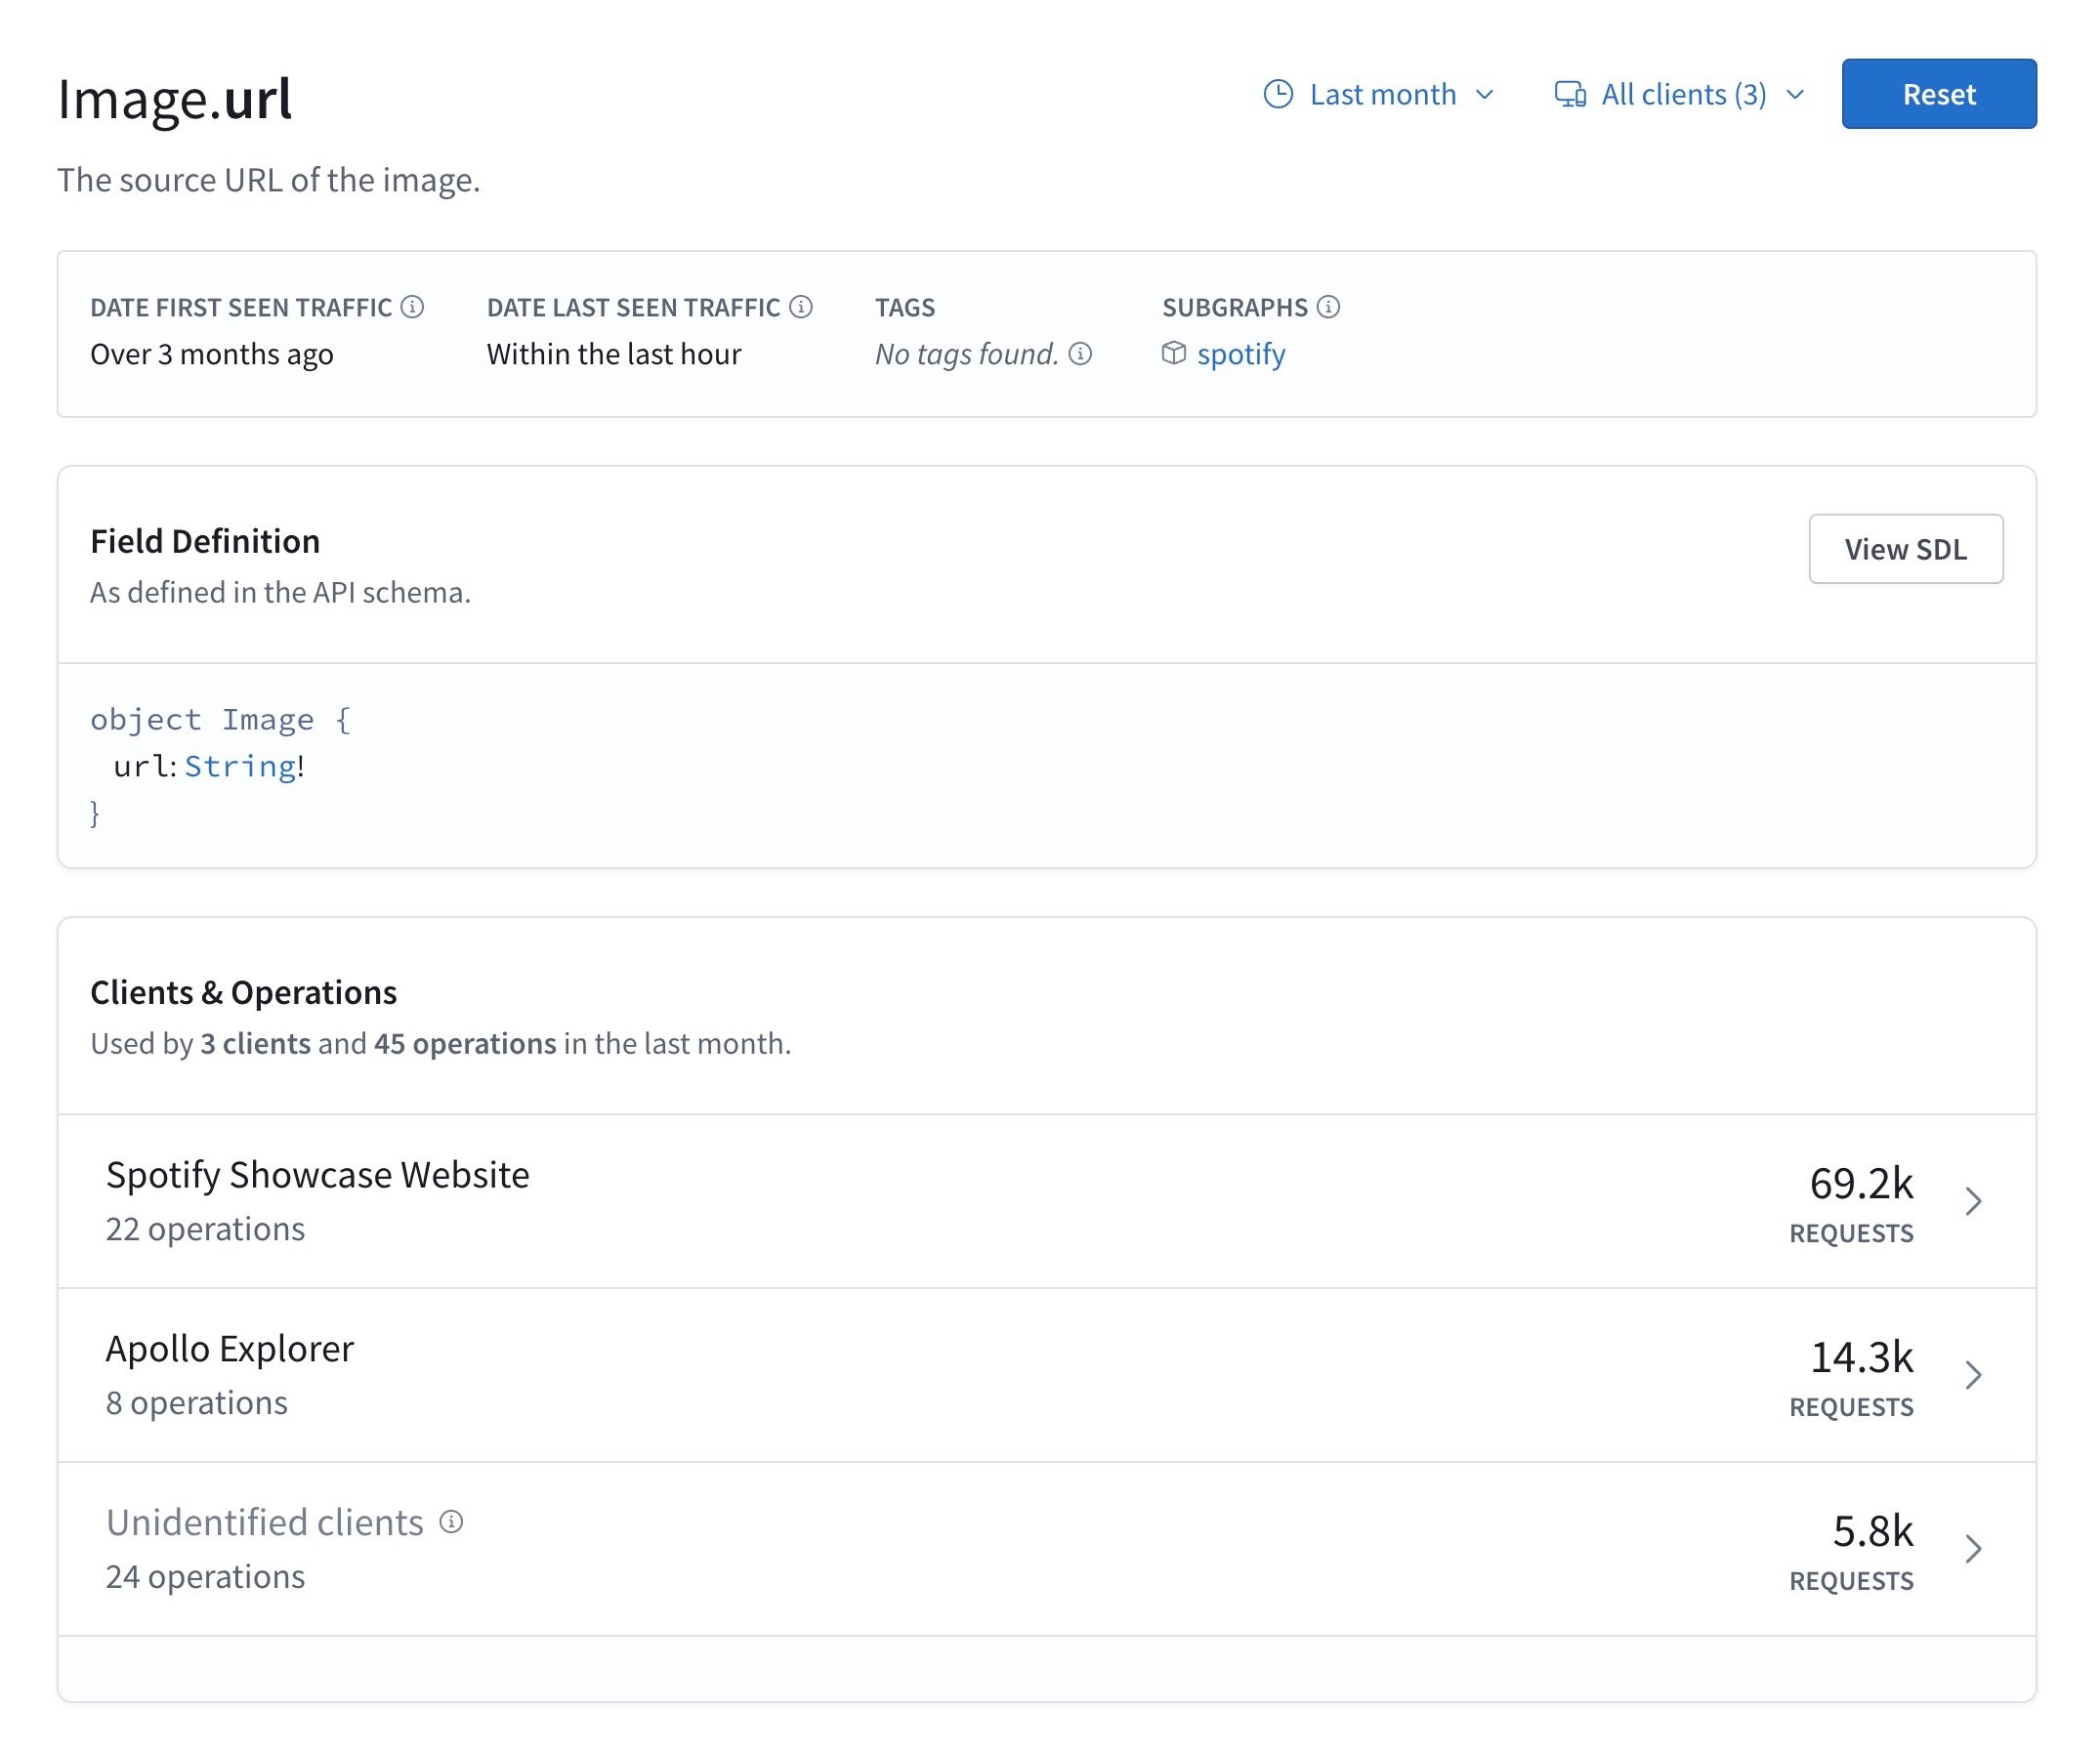
When you click a field name, you open detailed information for that field in the main insights view. This includes when the field first and last received traffic, any applied tags, and the subgraphs that provide the field.
Below that, you can view the field definitions within your subgraph schema.

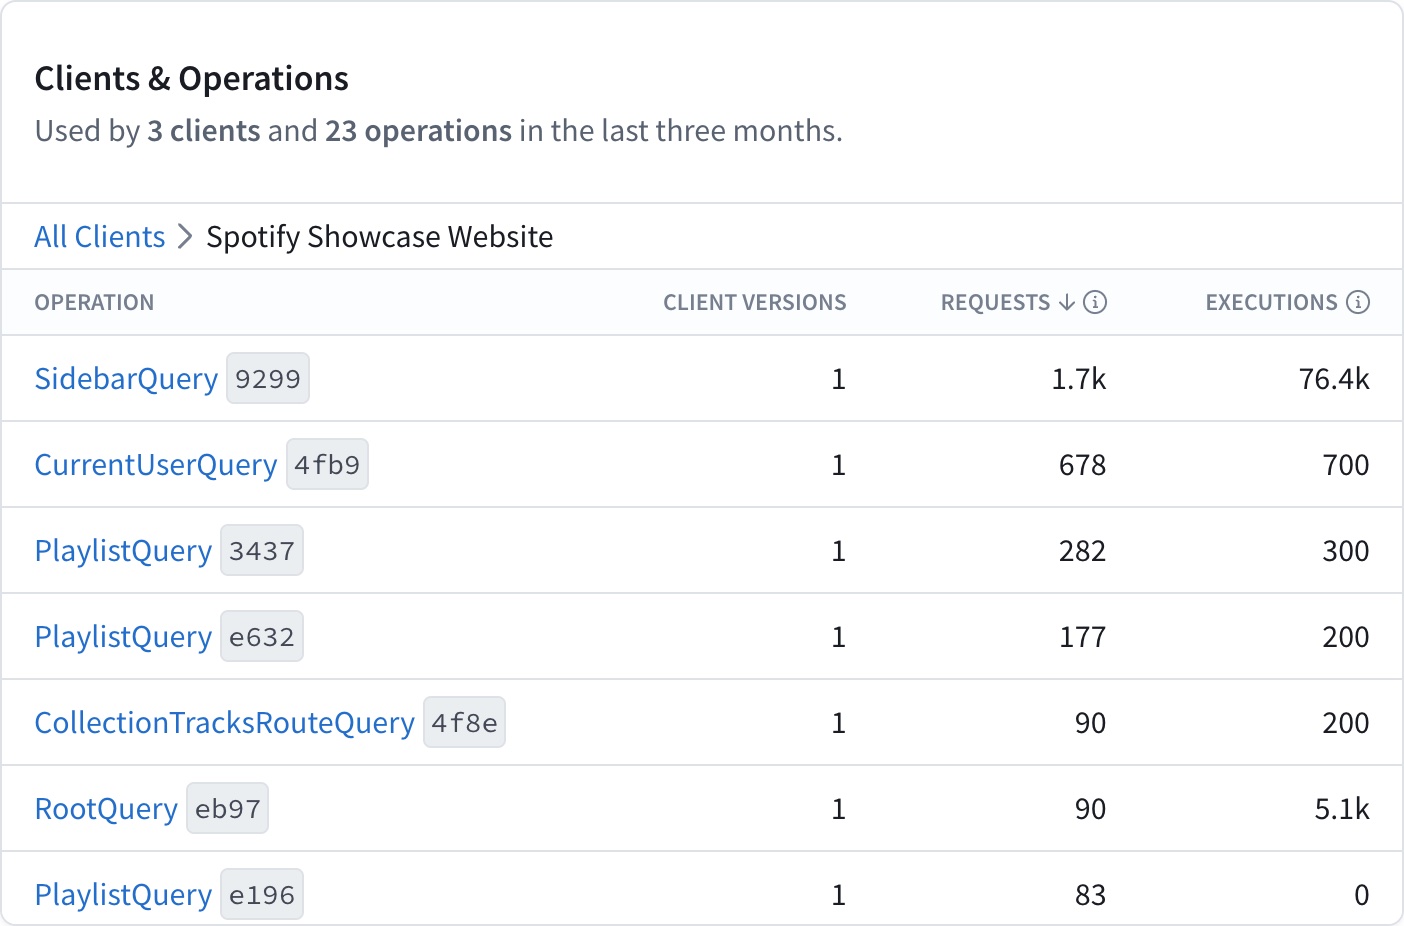
Next, you see which clients and operations contribute to the field's usage. Each row in the Clients & Operations table shows a client that requested the field, the number of operations that used the field the client made, and the total number of requests the client made. Selecting a client shows more details about the operations that requested and executed the field.
Below Clients & Operations, you can view visualizations for the field's request rate, latency distribution, and error metrics.
Field requests and executions
Each row in the Clients & Operations table displays some combination of the following metrics for each field, depending on which data you report to GraphOS:
| Metric | Description |
|---|---|
| Client versions | How many different client versions have sent the operation |
| Requests | How many operations sent by clients over a given time period included the field, according to metrics provided by your servers |
| Executions | How many times your servers have executed the resolver for the field over a given time period |
For each of these columns to appear on the Insights page, your GraphQL servers must report the associated metrics to GraphOS. If some but not all your GraphQL servers report this data, the Insights page presents an incomplete picture of your graph's field usage.
Take a look at the Requests and Executions for an example field:

As you can see, they can differ significantly. There are many possible reasons for this, described below.
Objects in lists
Let's say a client executes the following query one time:
query GetBooks {books {title}}
If Query.books returns a list of ten Book objects, then Book.title is resolved ten times. This query, therefore contributes just one request but ten executions to the Book.title field.
Multiple references to a field
Let's say a client executes the following query one time:
query GetTwoBooks {firstBook: book(id: "123") {title}secondBook: book(id: "345") {title}}
This operation includes two references to the fields Query.book and Book.title. Therefore, the resolvers for these fields each execute twice (assuming Query.book doesn't return null). However, these multiple references are all part of a single operation.
Therefore, this query contributes just one request but two executions for each of the Query.book and Book.title fields.
Fields that return interfaces
Let's say our GraphQL server's schema defines the following interface and object types:
interface Media {title: String!}type Book implements Media {title: String!author: String!}type Query {favoriteMedia: Media!}
Now, let's say a client executes the following query:
query GetFavoriteMedia {favoriteMedia {title}}
If Query.favoriteMedia returns a Book object here, then Book.title is resolved one time. However, the original query does not reference Book.title. Instead, it references Media.title, because Query.favoriteMedia has a return type of Media.
Therefore, this query contributes zero requests and one execution for Book.title. It also contributes one request for Media.title. Note that interface fields always have zero executions.
Requested fields that aren't resolved
Let's say a client executes the following query one time:
query GetLoggedInUser {loggedInUser {name}}
Now, let's say Query.loggedInUser returns null because no user is logged in. In this case, the resolver for User.name never executes, because its parent returns null. Therefore, this query contributes one request and zero executions for User.name.
A requested field might not be resolved for any of these reasons:
- The field is nested under a field that returns
null, as shown above. - The field is nested under a field that returns a list, but the list is empty.
- The field is part of a fragment that doesn't apply to a particular object.
- The resolver is skipped due to a
@skipor@includedirective.
@key and @requires fields in a federated graph
ⓘ NOTE
This case applies only to graphs that use Apollo Federation.
Let's say our federated graph includes these two subgraph schemas:
type Product @key(fields: "id") {id: ID!name: String!}
extend type Product @key(fields: "id") {id: ID! @external}type Review {id: ID!score: Int!product: Product!}type Query {reviews: [Review!]!}
Now, let's say a client executes the following query:
query GetAllReviews {reviews {scoreproduct {name}}}
This query's execution starts in the Reviews subgraph, but it needs to obtain each Product's name from the Products subgraph. As part of this process, the Products subgraph must resolve references to Products provided by the Reviews subgraph.
To help resolve these references, the Reviews subgraph must return each Product's id field, even though that field isn't included in the original query. This is because id is a @key field for Product.
Therefore, this query contributes zero requests and one execution for Product.id. Similar logic applies to fields that use the @requires directive.